
Making technical analyses
As a stock market trader, you have one goal: to make a profit. To make a profit, you need a good understanding of how the market works and what external factors influence the stock market. Analyzing stock market trends is called technical analysis. Without such an analysis, you cannot make a profit consistently. Of course, you will sometimes get lucky, but without understanding and analysis, it will remain a matter of luck.
With the help of a good technical analysis you can make good decisions about what to invest in, when and when to stop. Based on this analysis you manage your investment portfolio. Below you can read what this analysis entails and how you can make one.
The technical analysis in detail
When you create a technical analysis, you use the price movements of the past to predict the future. In fact, you do nothing more than follow the stock market trends and use the knowledge you gain from this to further predict the trend. With this analysis, you learn about the behavior of the market and you will better understand what the thoughts of traders are. Based on a certain event, you can then predict the behavior. This analysis can be used for any type of tradable good. After all, you learn the workings of supply and demand and how people react to this.
Technical analysis has some basic principles that you should know and that are based on the Dow Theory of Charles Henrey Dow. This economist did research for years on the behavior of the price on financial markets and wrote about this in the Wall Street Journal (WSJ) from 1889. Technical analysis is therefore based on his principles and these are as follows.
- As a technical analyst you assume that the news is incorporated into the market trends. The market knows everything and is always right.
- Market trends move cyclically and history repeats itself. If we look at trends over long periods, we see similar movements.
For now, it should be added that technical analysis is not a science like physics. The analysis is not always conclusive and can sometimes give incorrect results. You probably know the phrase: the past offers no guarantee for the future. As an entrepreneur, you use the analysis, but it does not offer you certainty. If you are going to use the analysis, the following points must be important;
- Making a good technical analysis requires a lot of knowledge and practice
- The analysis does not give 100% for your predictions
- In order to make a good analysis it is important to use different instruments in order to arrive at valid results
Technical analysis versus fundamental analysis
You analyze effects to create more certainty for yourself about the chance of success of the effect. The two major forms of doing analyses are compared here. With a fundamental analysis you can see whether a share is too expensive or perhaps very cheap. Based on this knowledge you can then determine whether your investments are doing well or not. However, with a technical analysis you do not look at the current situation or the current company results. With a technical analysis you make decisions based on trends: ‘I see this trend and based on reactions to such a trend in the past I make the following decision, because I expect X and Y to happen.
When you focus on trends and patterns in the price, this is called visual analysis within technical analysis . In addition, you can also focus on certain indicators, which are built in by online brokers. This is called quantitative analysis.
Fundamental analyses are often used more by long-term investors, such as investing in shares. These fundamental analysts look at the statistics of the company in question and based on this they make predictions and decisions. Questions arise about the price of the share, the company prospects and the profit margin of the company. A technical analyst does not look at the company, but at the price trends. By following the price of the shares, this analyst gets all the information he/she needs to make a good decision.
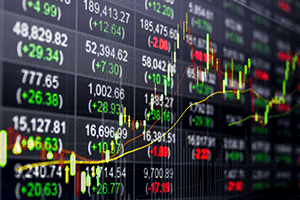
The price chart
In the meantime, you have come to realize that a technical analyst only follows the price and does not concern himself with anything else. The price is followed by looking at the price charts and the investment choices are made based on the information from these charts. There are a large number of different charts available to look at. For example, you have the bar and line charts, but also the candlestick chart. These candlestick charts are very popular nowadays because they are easy and quick to read. They look like red and green candles. Based on the candles and the color, you can see whether a price is falling or rising at a glance.

What exactly can you read in the candlestick chart? First of all, you look at the color of the candle. When the candle is green, the price is rising on this day. However, pay attention to this, because this is not about an upward trend compared to the beginning of the day, but the beginning of the candle. It is therefore important to know what the starting point of the candle is. A red candle logically indicates a downward trend in the price.
The part of the candle that is colored in is called the body of the candle or in jargon the body. The bottom of a green candle indicates the opening price of the day and the top the closing price. For a red candle it is exactly the other way around. At the bottom you see in this case the lowest point of this day and at the top the highest price value of that day.
In the cases above, we were actually talking about day candles. The candles start at the opening of the stock market and close at the closing of the stock market. However, there are many different types of candles in terms of length. For example, they actually exist in every type of duration, but those of 1, 5 and 15 minutes are often used. These are particularly popular with day traders. Candles of 1 hour, 2 or 4 hours are usually used by swing traders and candles of 1 or more days by traders who want to have a larger overview of the trend. In short, it is very important for the correct reading of a candlestick chart to know what the time frame of the candle is.
How to recognize a trend: the price cycle
Now that you have more knowledge about some basic principles of technical analysis, it is time to actually perform technical analysis. For this, you need to know how to recognize trends and read prices .
As mentioned, the analyst assumes that the price moves in a trend and that this creates price cycles. A cycle can be divided into 4 phases. You as an analyst must first answer the question of which phase the price is in, in order to then be able to determine what the price will do. What are the 4 phases?
The first phase: a sideways trend
In this phase, the price moves sideways. Some analysts also call this phase the accumulation phase. This phase is characterized by a stable market. There are certainly peaks and troughs, so that short-term investors and traders can certainly make money, but the peaks always hit a certain ceiling and the troughs do not fall below a certain level. As a result, long-term investors can do little in this phase. Despite the fact that the market is stable, the peaks and troughs can still swing quite a bit.
As an analyst, you need to know exactly what the resistance level is above and below the price. Because when this resistance is broken, it means that we are moving to another phase. If the resistance is broken at the top, then the buyers have taken over. We speak of an actual buy signal when the broken resistance is at the closing of the market, the breakout is substantial and is accompanied by large volumes.
The second phase: an upward trend
After the first phase, which is concluded with the breakout and the buy signal, the price will start to rise. We can recognize this because the peaks and troughs are getting higher and higher. This makes every correction worth buying. Only when the peaks and troughs start to fall again in general, the rising trend comes to an end. We can recognize three types of rising trends:
- First of all, there is a ‘strong upward trend’. This can be recognized by the fact that there are only small corrections. This results in the fact that the new lows are above the old highs.
- In addition, we have a ‘normal rising trend’, which can be recognized by the image that the new troughs are around the level of the old peaks.
- Finally, we have the ‘weakly rising trend’, where the new troughs are below the old peaks. There is still a rising trend because the peaks and troughs are higher than before.
The third phase: another sideways trend
Unfortunately, after every rising period comes a phase of consolidation. This third phase is also sometimes called the distribution phase. The fact that the rise stops does not mean that this is immediately a sell signal. The price can simply continue to rise after a short period of consolidation. However, as an investor you should be vigilant during this period for a decline in the trend.
The fourth and final stage: the downward trend
If the price actually starts to fall and falls significantly below the support level, then a sell signal will be given. For example, if you start selling shares , then the price will naturally fall even faster. Now you have to act quickly, because you don’t want to be in long positions anymore. The market is now falling quickly and is very volatile. Just like with a rising trend, we will remain in this phase until consolidation occurs again.
Here too we can speak of three types of downward trends that are identical to upward trends: Strong downward, normal downward and weak downward. To determine which of the three we are talking about, compare the new tops with the old bottoms.

Sideways trend

Rising trend

Downward trend
Trendlines, resistance and support
Now you have an idea of how to read a price. You should be able to figure out what phase the price is currently in. You can also discover what kind of upward or downward trend you see. With this knowledge, you can already make much better decisions about buying and selling on the market. For now, we will conclude by going into a number of technical terms that you need to make a good technical analysis: resistance, support and trend lines.

Resistance
For resistance, we look at the peaks of the price. The price always seems to start to rise or to continue, but this does not work, because the price encounters resistance. After reaching this ceiling, the price drops again, which means that you as an analyst see a peak forming. When you can connect peaks on the same line, you have a resistance line. If this line is broken by an upward trend, this can be a buy signal because a period of upward movement may begin.
Now what happens at a point of resistance? In this case, there are investors who continuously start selling their shares or reducing their position at this point. Some extra confidence is needed to break through this point.
Support
Support is actually exactly the same as resistance, but then we are talking about the dips in the price. Every time the price drops, but then bounces back, we speak of support. When you have multiple support points, you can draw a support line. When the price approaches this line, traders start buying shares. They therefore have confidence in the share at that price. When the price goes significantly below the support line, we enter a period of decline and a sell signal follows.
Trend lines
Finally, we look at trend lines. An analyst only speaks of a trend line if a line can be drawn over 3 or more price peaks. This also applies to price troughs. The more peaks or troughs can be included in the line, the more reliable the trend line is. The analyst speaks of a trend channel if the price moves exactly between two trend lines that are parallel to each other.
Compare brokers and start investing
Are you excited about investing through technical analysis after reading this article? Use our comparison function and find the broker that suits you best!