
What is volatility?
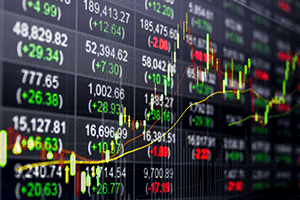
Share prices never stand still. Everyone knows the graphs of shares, even if you have never invested yourself. Prices can rise, fall or remain more or less at the same level. The extent to which prices fluctuate is called volatility .
Low volatility is said to occur when the price does not rise or fall much. The price remains more or less the same. This is called a stable price.
With high volatility, the price fluctuates a lot. It rises and/or falls with great regularity.
Whether the price falls or rises does not matter for the term “high volatility”.
Types of volatility
There are two types of volatility.
- Historical volatility
- Implied volatility
Historical volatility indicates what the volatility of a stock has been in the past . In other words, what the volatility of the stock has been.
If this was low, the share has had a stable price in the past.
If historical volatility has been high, the stock has experienced many fluctuations in the past.
Implied volatility is precisely about the future volatility of a share. With the understanding that these are derived from option prices . Of course, no one can predict the market. Read more about options .
Option prices are also no substitute for a crystal ball with which the future can be predicted, but they are a good indicator. Because option prices are linked to market expectations.
If the market expects that there will be movement (high volatility) with a stock, the option price will rise. Option prices fall when the market expects that not much exciting will happen with a stock. (low volatility)

Calculating stock market fluctuations
Volatility can be calculated. Since historical volatility already knows what the share has done in a certain time frame, a calculation can also be made over that period. Historical volatility is always calculated over a period of one year. The calculation is as follows:
Subtract the lowest achieved effect from the highest achieved effect of the past year. Now you have value A.
Then you add the highest achieved effect and the lowest achieved effect together. Then you divide the result by 2. Now you have value B.
Now you divide value A by value B and the result is expressed as a percentage. The higher this percentage, the higher the expectation will be that the share will move in the coming year.
Example: The Alpha share achieved a highest market value of €14.20 and a lowest listed market value of €12.80 in the period from October 31, 2019 to October 31, 2020.
The volatility of Alpha is (14.2 – 12.8)/((14.2 + 12.8)/2)= 0.1037037
Because the price volatility is expressed in percentages, you move the decimal point two places to the right, which in this case is 10.3%.
Calculate price movement and price forecast
If you know the volatility of a stock, you can also calculate a price forecast.
- The probability that the price movement for the coming year will adhere to the volatility is 68.3%.
- The probability that the stock will be in a range of a doubling of volatility in the coming year is 95.4%.
- The probability that the price will be within a range of three times the volatility is 99.7%.
These three probability calculations are fixed values, arrived at after statistical research of the complete history of the global stock markets.
The value of Alpha stock is now 14.20. The chance that the value of Alpha will be between €12.70 and €15.70 in a year is therefore 10.3%. (€12.70 = €14.20 – 10.3%, €15.70 = €14.20 + 10.3%)
The probability that the value of Alpha will be between €11.30 and €17.10 in one year is 95.4%. (€11.30 = €14.20 -20.6%, €17.10 = €14.20 +20.6%)
And the chance that the value of Alpha will be between €9.80 and €18.60 in a year is therefore 99.7%. (€9.80 = €14.20 – 30.9%, €18.60 = €14.20 + 30.9%)
This calculation allows you to calculate the risk you run when purchasing shares and other securities.
Play on price movements with CFDs
With CFDs you can easily respond to price increases and decreases. For this you need a broker. Find CFD brokers and compare .
Our reading tips
for the novice investor